
When we are developing in Javascript, sometimes we need to debug the code when we found an error. You can easily do debug with the Dev Tools of the browser.
If you press F12 on your browser you have access to a window like shown below and move to the debugger tab and your code you have a debugger; condition in your code, when you execute the action you will get the debug active and you can start moving on your code to see where the problem is.
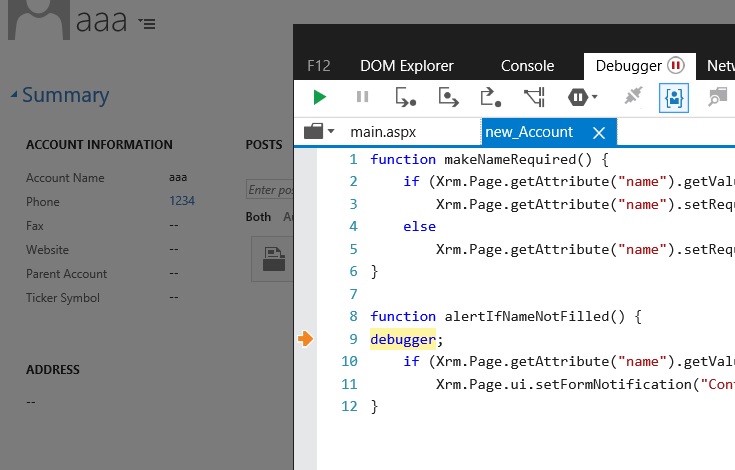
You can also search for the web resource file name and make a breakpoint on the DevTools instead if you don’t want to have the debugger; written in your code.

Hope this helps
